



TL;DR
India rose one place to reclaim the top spot on the EMT in May 2026, an index that has tracked 12 large emerging markets across seven high frequency indicators since September 2019: GDP growth, manufacturing PMI, export growth, retail inflation, import cover, exchange rate movement and stock market performance. The composite score of 68.05 reflected strength on the two indicators most tied to real economic momentum trade and factory output rather than a one off spike in a single metric.
Merchandise exports expanded 17.99% year on year in May, accelerating sharply from 13.8% in April, while the manufacturing PMI climbed to 55, signaling faster growth in factory activity. India also held an import cover of just over 10 months, a buffer that matters more than usual given the currency and inflation pressures building elsewhere in the data.
The other side of a stronger export and factory print was a weaker currency. The rupee depreciated 2.04% against the US dollar in May, its steepest monthly decline since March and its third consecutive month of losses. Average exchange rates moved from 90.7 per dollar in February to 95.5 in May, as elevated crude prices and the West Asia war weighed on the currency.
This matters directly for import dependent sectors: India sources more than 85% of its crude oil requirement from overseas, so a weaker rupee raises the landed cost of oil, LNG, fertilizers and industrial raw materials even when global commodity prices hold flat. Refiners pay more per barrel in rupee terms, transport companies absorb higher fuel bills, and manufacturers importing chemicals, metals and electronic components see input costs rise, costs that eventually surface in freight charges and factory gate pricing.
The flip side is a competitiveness tailwind for exporters, who earn more rupees per dollar of overseas revenue. But that benefit is uneven: sectors reliant on imported inputs: automobiles, chemicals, consumer goods and fertilizers among them face margin pressure unless they can pass costs through to consumers.
India’s Wholesale Price Index (WPI) inflation surged to 9.68% in May 2026, the highest reading in 42 months, according to the Department for Promotion of Industry and Internal Trade. The drivers were concentrated almost entirely in energy:
Products such as sulphur, aviation turbine fuel (ATF), liquefied petroleum gas (LPG), sulphuric acid and bitumen recorded some of the sharpest month on month and year on year price increases. The pass-through extended into manufactured products as well, with basic metals, chemicals and textiles facing higher input costs as firms absorbed costlier fuel and imported raw materials.
Wholesale inflation typically reaches consumers with a lag, which means the May print is a leading indicator of margin pressure rather than a fully realized cost. Crisil estimates that sectors accounting for 17% of India’s gross value added (GVA) face high exposure to rising energy costs, while another 39% falls into the moderate impact category: aviation, construction, chemicals, automobiles and engineering among the sectors most exposed unless they can pass costs through pricing.
Crude oil prices have eased following the Israel-Iran ceasefire, and both India Ratings and Icra expect this to soften WPI inflation in the coming months. India Ratings projects wholesale inflation moderating to around 9.3% in June. However, both agencies expect the adjustment to be gradual rather than immediate, as businesses work through inventories and supply contracts signed when oil prices were higher. Food prices add a further wildcard: elevated levels could persist if El Niño affects the monsoon, delaying broader disinflation.
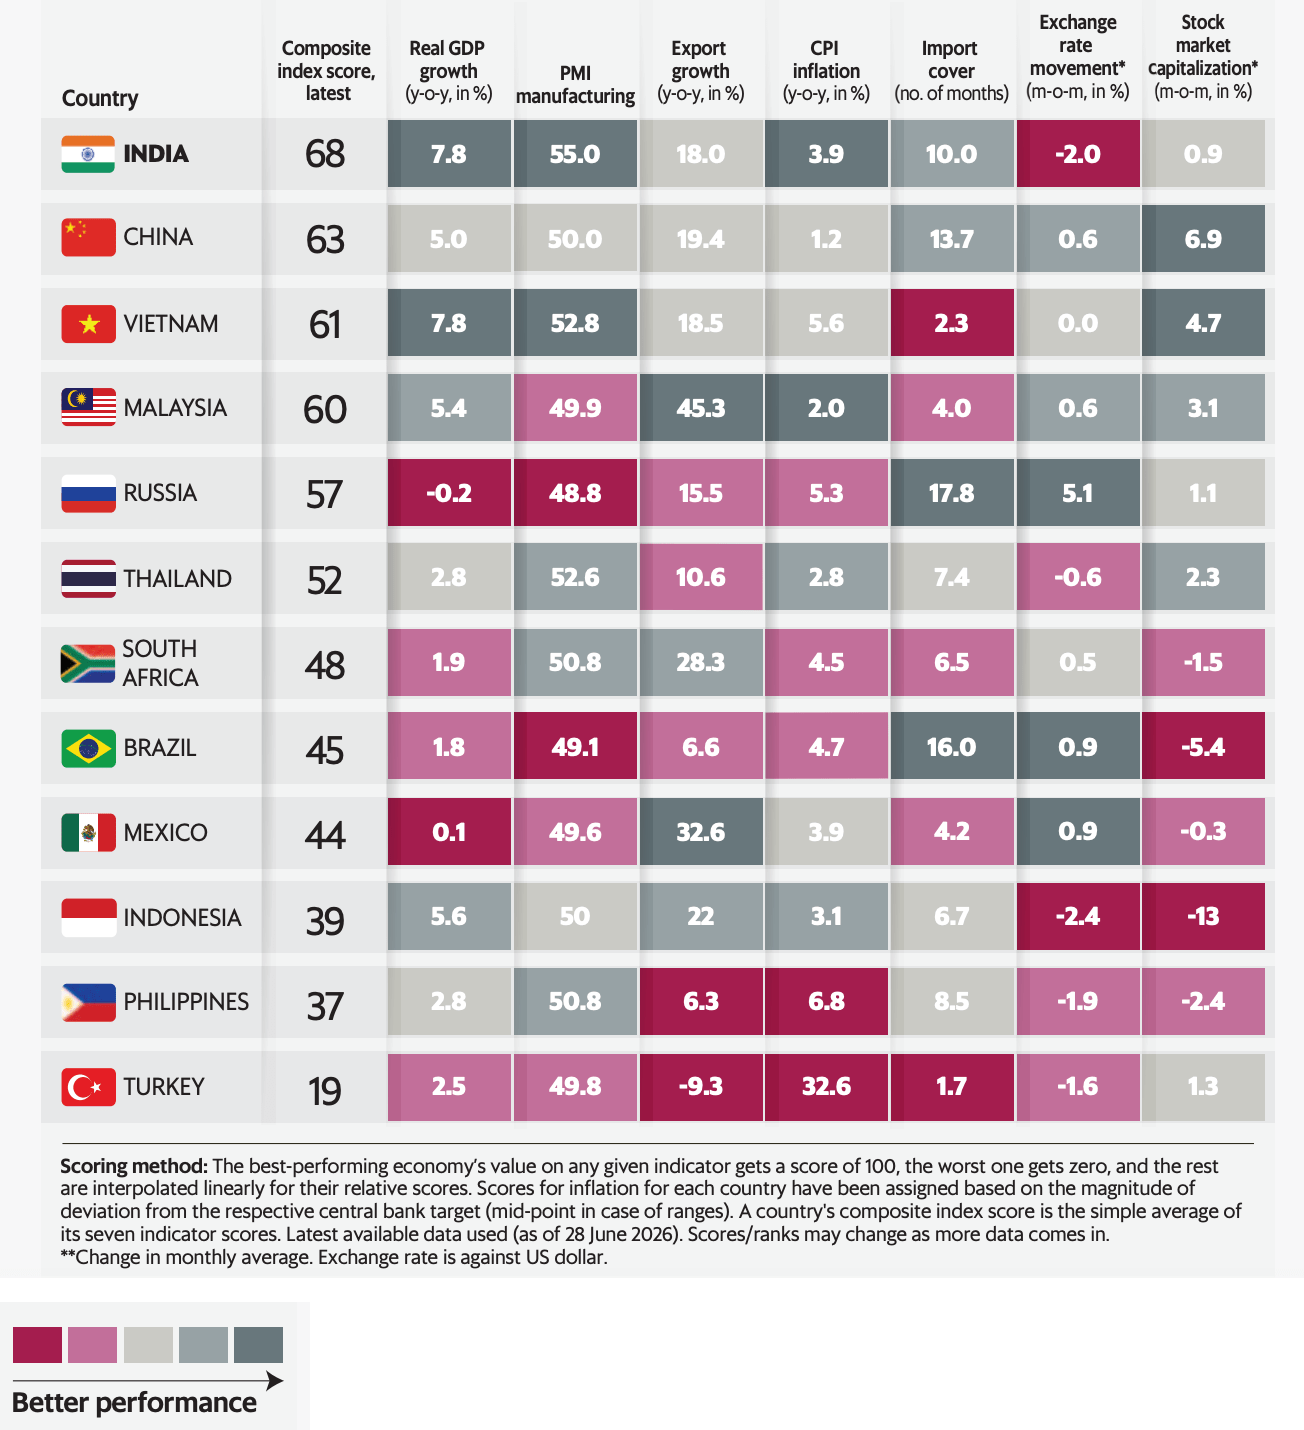
Source: Bloomberg, Mint calculations. Data as of 28 June 2026. Scores may shift as more data comes in.
China moved up two places to second, supported by 19.39% export growth the fastest among the top three economies and a 6.94% gain in stock market capitalization. Vietnam was the standout mover, jumping five ranks from eighth to third on 7.83% GDP growth, 18.52% export growth and a manufacturing PMI of 52.8, underscoring its position as one of Asia’s fastest growing manufacturing and export hubs.
For allocators tracking India’s private markets and macro trajectory, the May 2026 data present a two-sided picture that’s worth holding in tension rather than resolving too quickly:
Reference: Mint’s Emerging Markets Tracker, “India Tops EMs in May Despite Oil Concerns” (Plain Facts, Mint, 30 June 2026), based on Bloomberg and Department for Promotion of Industry and Internal Trade data.


TERMS OF USE
Thank you for your interest in our Website at https://unlistedintel.com/. Your use of this Website, including the content, materials and information available on or through this Website (together, the “Materials”), is governed by these Terms of Use (these “Terms”). By using this Website, you acknowledge that you have read and agree to these Terms.
NO OFFER, SOLICITATION OR ADVICE
Our site is provided for informational purposes only. It does not constitute to constitute (i) an offer, or solicitation of an offer, to
purchase or sell any security, other assets, or service, (ii) investment, legal, business, or tax advice, or an offer to provide such advice or (iii) a basis for making any investment decision.
The Materials are provided for informational purposes and have been prepared by Oister Global for informational purposes to acquaint existing and prospective underlying funds, entrepreneurs, and other company founders with Oister Global's recent and historical investment activities.
Please note that any investments or portfolio companies referenced in the Materials are illustrative and do not reflect the performance of any Oister Global fund as a whole. There is no obligation for Oister Global to update or alter any forward-looking statements, whether as a result of new information, future events, or otherwise.
PURPOSE LIMITATION AND ACCESS TO YOUR PERSONAL DATA:
We will only collect your personal data in a fair, lawful, and transparent manner. We will keep your personal data accurate and up to date. We will process your personal data in line with your legal rights. We use your name and contact details, such as email, postal address, and contact number to continue communications with you. We may also use your contact information to invite you to events we are hosting or to keep you updated with our news.
USE OF COOKIES OR SIMILAR DEVICES
We use cookies on our website. This helps us to provide you with a better experience when you browse our website and also allows us to make improvements to our site. You may be able to change the preferences on your browser or device to prevent or limit your device’s acceptance of cookies, but this may prevent you from taking advantage of some of our features.
MATERIAL
The material displayed on our site is provided “as is”, without any guarantees, conditions, or warranties as to its accuracy, completeness, or reliability. You should be aware that a significant portion of the Materials includes or consists of information that has been provided by third parties and has not been validated or verified by us. In connection with our investment activities, we often become subject to a variety of confidentiality obligations to funds, investors, portfolio companies, and other third parties. Any statements we make may be affected by those confidentiality obligations, with the result that we may be prohibited from making full disclosures.
MISCELLANEOUS
This Website is operated and controlled by Oister Global in India. We may change the content on our site at any time. If the need arises, we may suspend access to our site, or close it indefinitely. We are under no obligation to update any material on our site.
CONTACT INFORMATION
Any questions, concerns or complaints regarding these Terms should be sent to info@oisterglobal.com




 Learn More